Statistical Plotting Utility 

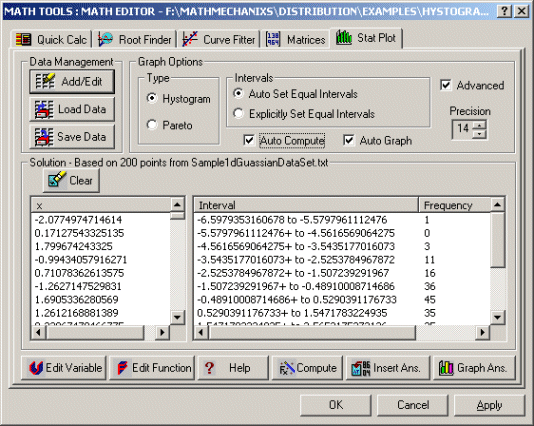
The new Statistical Plotting Utility (released with version 1.5.0.3) will allow you to easily build Histograms and Pareto Charts from manually entered data or from imported data loaded from ASCII Text or CSV files.

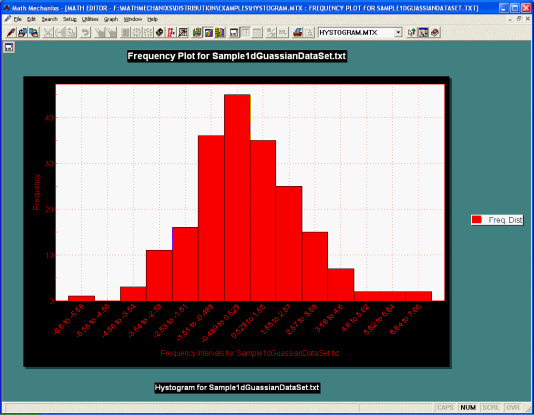
You can easily select from two chart types, histogram or pareto, plus you can either let Math Mechanixs compute the optimal frequency interval or you can explicitly set the number of frequency intervals to use in creating your plot. Below is an example of a histogram plot.

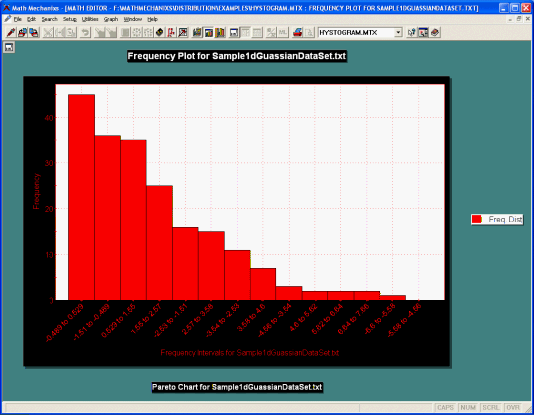
Also, as previously mentioned, by clicking the pareto button, you can quickly change your histogram to a pareto chart.

Back to Top | E-mail to friend | Affiliates
