Key Features Of Math Mechanixs Graphing:
Math Mechanixs has many features that will not only out perform a graphing calculator, but will demonstrate why using a computer to solve math problems is what computers were created to do.
- You can compose 2D and 3D graphs, from both functions and data points.
- Superior quality color graphing of mathematical expressions.
- Supports zooming, spatial rotation on all axes, translation and point labels.
- User definable labels on axes, header and footer or use defaults.
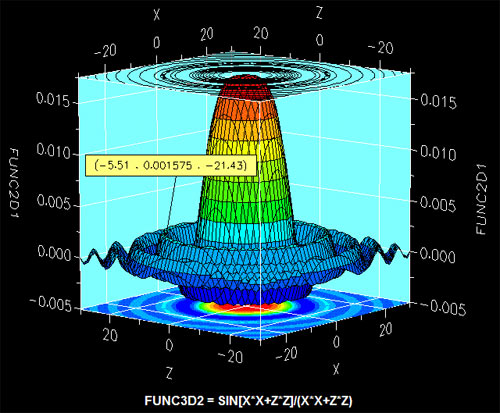
- Select any point on the graph and get a text box containing its coordinate value.
- Save your graph, print it in full color or cut and paste it.
- Choose your colors or use defaults.
- Complete context sensitive help.
2D Graphic Simulation
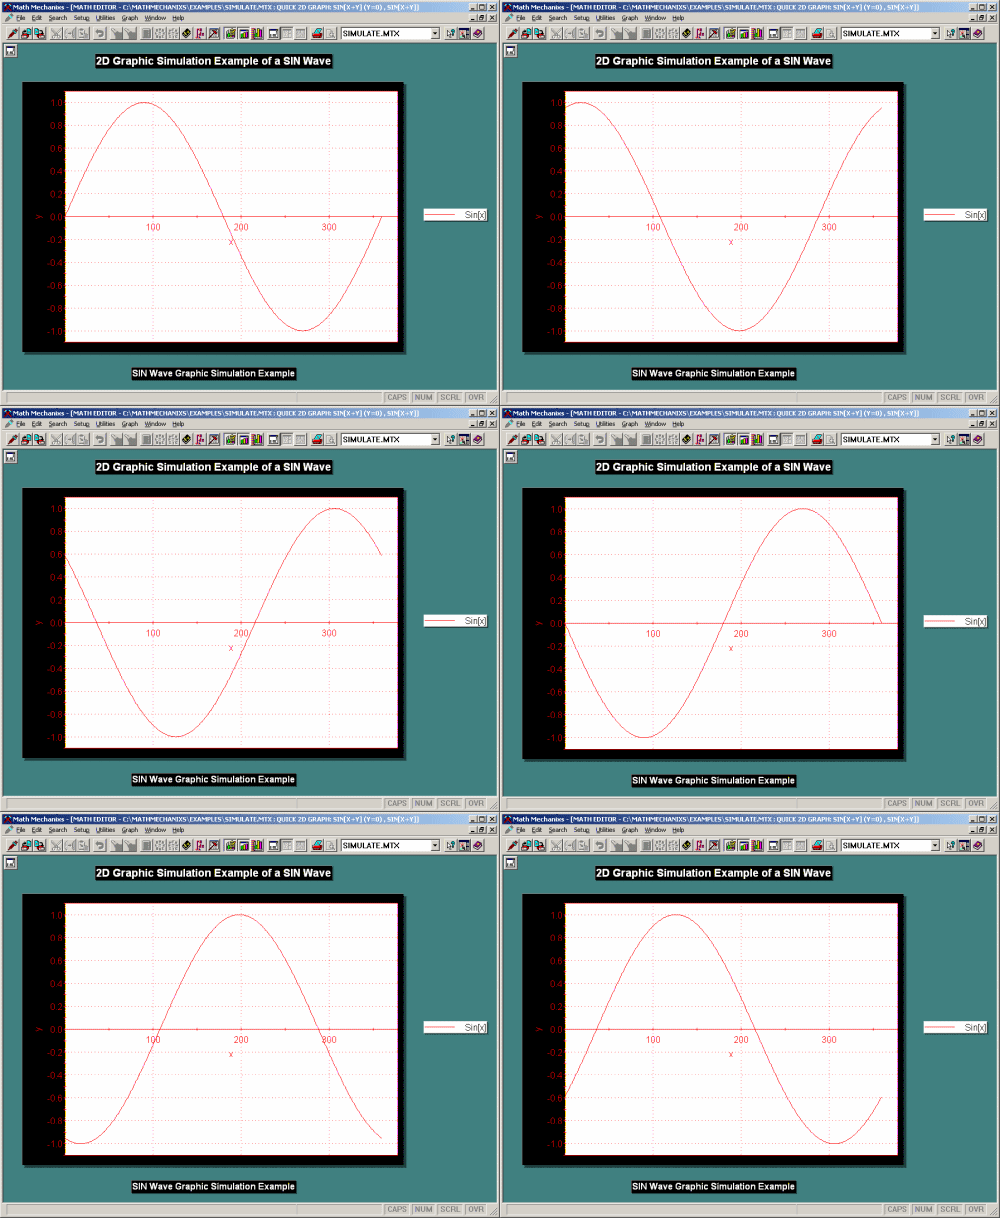
Released in version 1.4.0.4, Math Mechanixs offers the ability to easily create 2D Graphic Simulations. By varying a secondary variable in your governing function, you can create a succession of curves that can be run together like a movie giving you the ability to quickly visualize how this variable affects the function and graph.

The Quick Graph Utility
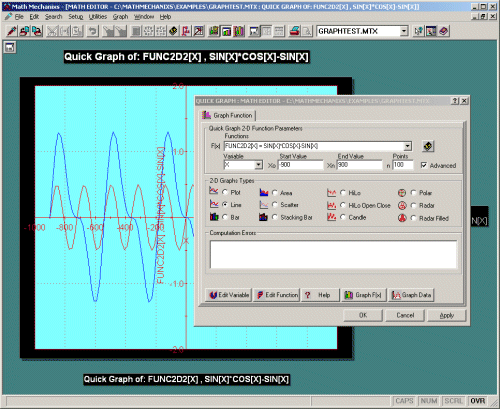
Quick Graph, released in version 1.3, promises to make 2D graphing of mathematical expressions as easy as 1, 2, 3. Simply enter your mathematical expression, select or enter the x-axis variable, enter the range and number of points, and press the graph button. Your graph will intantly appear... Ok, so maybe it is more like 1, 2, 3, 4... but we still guarantee that this new utility makes graphing so simple, a baby can do it!

Supported 2D Graph Types
 Line
Line Point
Point Area
Area Bar
Bar Scatter
 Stacking Bar
 Hi-Lo
Hi-Lo Hi-Lo Open Close
 Candle
 Polar
Polar Radar
Radar Radar Filled
 Pie Charts
Supported 3D Graph Types
![]() Surface and
Surface and ![]() Bar Graphs which include options for display of:
Bar Graphs which include options for display of:
- Hidden Lines
- Surface Projections
- Mesh
- Contours
- Shaded Regions
- Zones

Back to Top | E-mail to friend | Affiliates
